Introduction. Angles in Geometry and in Trading
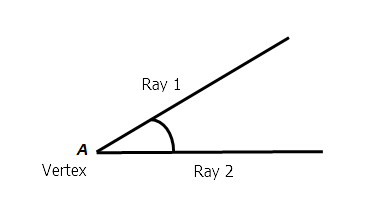
In geometry, an angle is the figure formed by two rays (the sides of the angle), sharing a common endpoint (the vertex of the angle).
The following angle calculation and construction options are provided in the MetaTrader 4 terminal.
1) A simple angle (Trend Line By Angle).
2) Gann Fan Angles.

3) Gann Grid.

The above examples available in the terminal are based on popular trading methods using angles described by Gann.
There are some advanced trading developments that are based on the angle analysis. One of the positive innovative approaches to technical analysis using angles is the indicator SinFractal by A.Praslov. The below figure describes the essence of trend analysis using angles.

Based on SinFractal calculation, the author managed to create a series of angle indicators for the simultaneous analysis of 28 currency pairs on multiple timeframes. This method enables successful trading using a basket strategy.
A question may arise here: Why are ready angle solutions offered by Gann not enough? For me personally, the answer to this question lies in the fact that Gann continued to study angles, trying to improve the angular trend analysis technique.
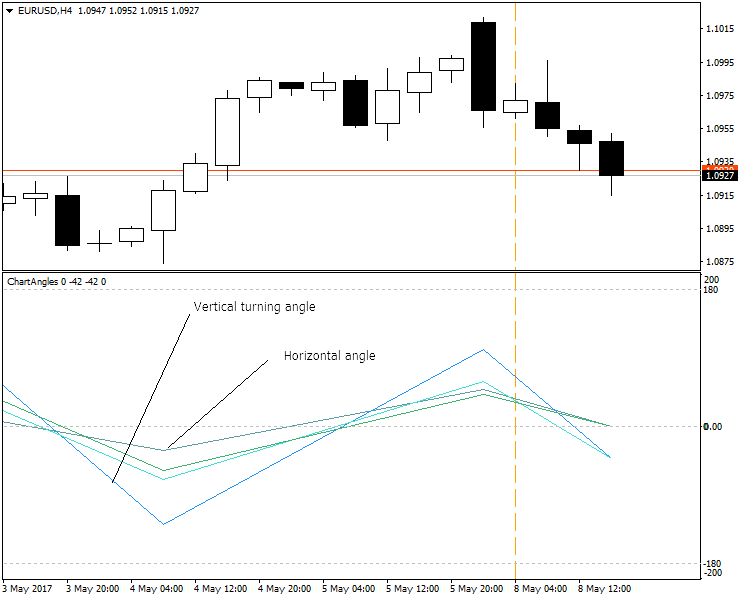
In my opinion, a clear theory of how to use angles in trading has not yet been developed. In addition to traditional angles (including those used in SinFractal), I suggest adding new types to improve the quality of the analysis: vertical and turning angles.
Light Beam Physics and Trend Movement: Optical Analogies in Technical Analysis
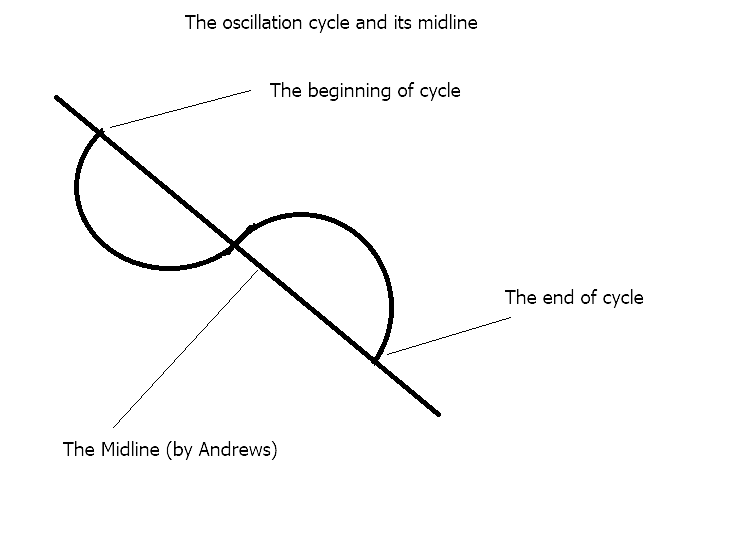
The author of Forks and the median line Andrews suggested that financial markets are subject to the laws of physics. Andrews used to draw a normal cycle and to correlate cycle trend movements with its oscillation phases.
Andrews' idea that the laws of physics can help in understanding what is happening with the trend suggests that the trend looks like a beam of light that falls from the sellers' environment to the customers' environment. This phenomenon can be correlated with the optical laws of reflection (the angles of an incidence ray and a reflection ray). In optics we rely on the angles formed by the falling angle and the OY, while all the above angles in trading are formed by a trend line and the axis OX axis.
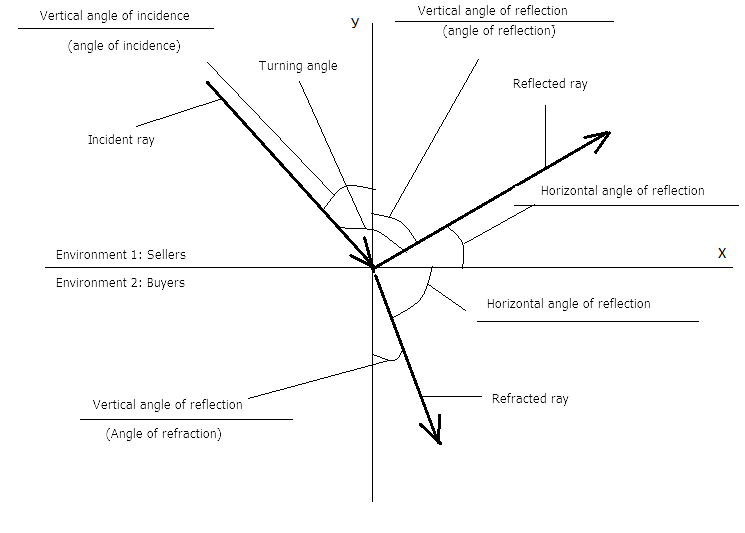
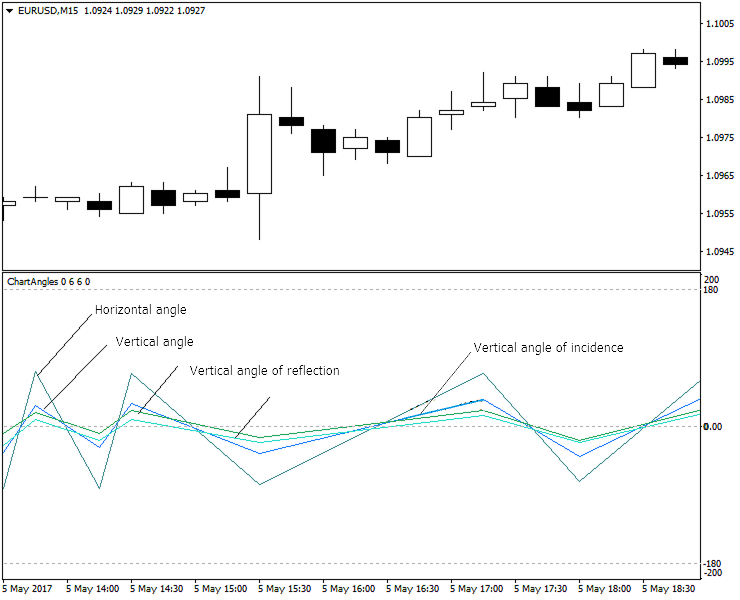
Thus, following the laws of optics, we get a new type of angle on our charts, i.e. a vertical angle (which is an angle between the trend and the OY axis).
And, finally a turning angle which is well known for all traders. Consider this angle from the point of view of optics.
The laws of optics allow considering trend similarly to a ray of light. Accordingly, we will try to extrapolate the physics of the light beam propagation to the behavior of a trend. A light ray is reflected from the surface, and trend direction is changed to the opposite, i.e. reverses. If we use the laws of light dispersion (decomposition) of light, we can observe a number of interesting analogies.
- In optics, dispersion is the decomposition of white light into a spectrum consisting of monochromatic colors. In technical analysis, dispersion is the decomposition of the whole trend into a series of separate trends formed on smaller timeframes.
- In optics, the media refractive index depends on its frequency (color), and in technical analysis this means that the turning angle for each of the minor trends within the major one will be different, depending on the timeframe.
These trend properties borrowed from optics, allow analyzing the trend as a wave. This analysis can be related to the Elliott wave theory, which is also very popular in technical analysis.
Measuring Angles on Price Charts
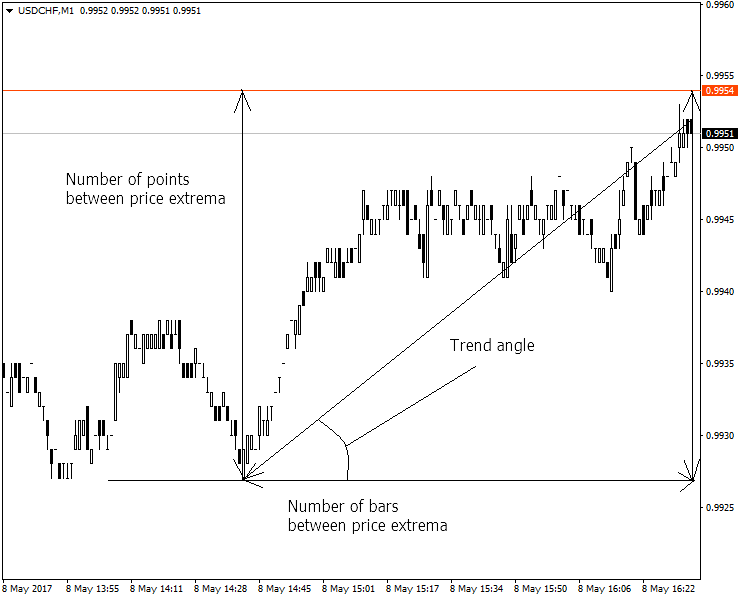
To measure angles by three points, we use the Angles_3_points angle indicator, which calculates the angle based on the point-to-minute ratio.
The indicator calculates the angles using inverse trigonometric functions: the tangent of the angle is calculated first, using the ratio of the opposite leg to the adjacent one, whose lengths are known. Then arctangent is calculated based on it, i.e. the angle size in degrees. This value and the difference between extremes in pips and values are displayed on the price chart.
Important note: the value of the actual calculation angle can visually differ from the angle shown on the chart.
The actual calculated angle is a certain precise angle value. The original algorithm of precise angle calculation is provided in the indicator source code.
The visual angle shown on the chart is converted by the terminal for the convenience of perception of the entire price chart with a specific time and price scale.
The visual angle shown on the chart is converted by the terminal for the convenience of perception of the entire price chart with a specific time and price scale.
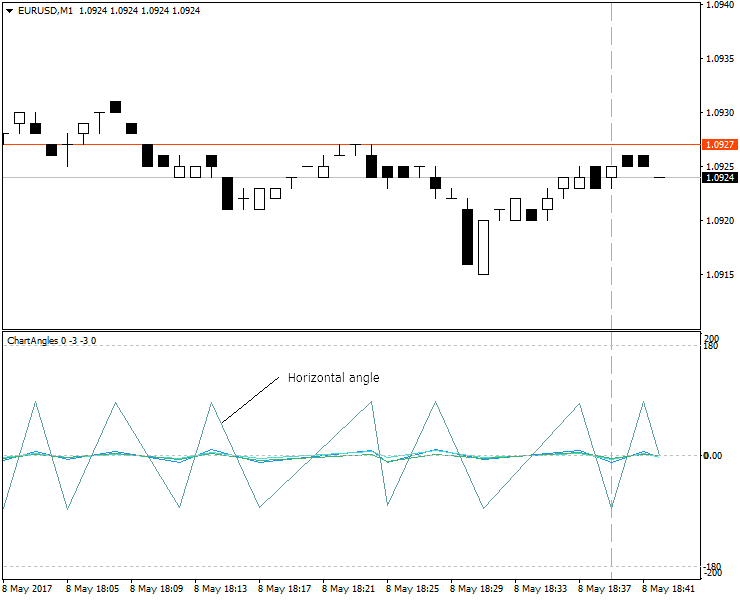
Example of measuring the turning angle on the M1 timeframe.

The M1 timeframe provides a very detailed market picture which inevitably contains a huge amount of strong price noise. Filtering this noise on M1 is a non-trivial task, and we don't need it now. Let us remember the value of the lower turning angles on this timeframe: 48 degrees.
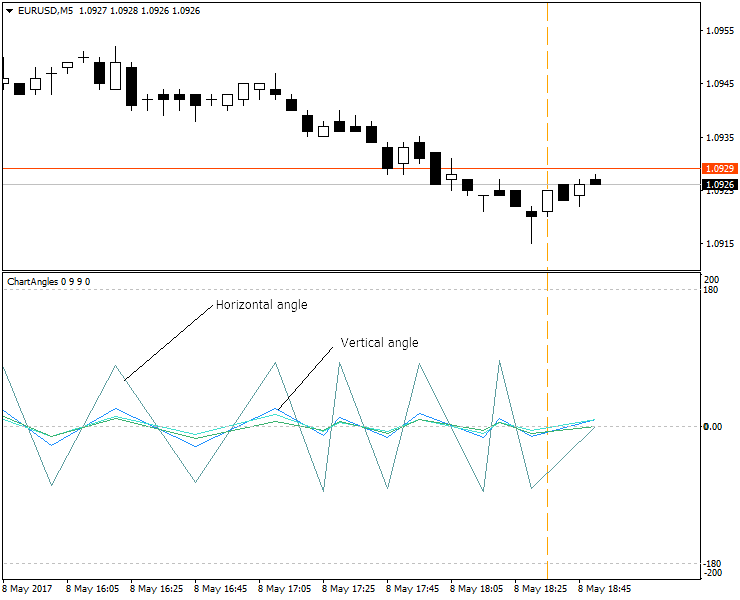
Let's increase the timeframe. The turning angle has changed on М5 and is now equal to 104 degrees. That's how it looks like:

The angle has become larger on М15 and is now equal to 112 degrees.

For Н1:

For Н4:

D1:

Examples of different turning angles confirming the assumption that the current trend consists of a sum of trends on separate timeframes are similar to Newton's law of the separation of white light into component waves.
The following conclusions can be made based on the above.
1. Individual trend reversal angles exist on each timeframe for each currency pair.
2. Upper and lower turning angles have individual sizes.
4. Vertical levels (formed by the trend and the OY axis) can be used for the analysis similar to traditional horizontal angles (formed by the trend and the OY axis).
5. Since each timeframe contributes to the general trend, there are two methods of trend analysis using angles:
a) analyzing each trend on each timeframe separately
b) analyzing the overall (mean average) trend
However, using pure laws of optics for trend interpretation is not enough. The trend, like any physical process, needs to be considered in detail.
For example, the effect of the angle of incidence is still useful for the technical analysis purposes.
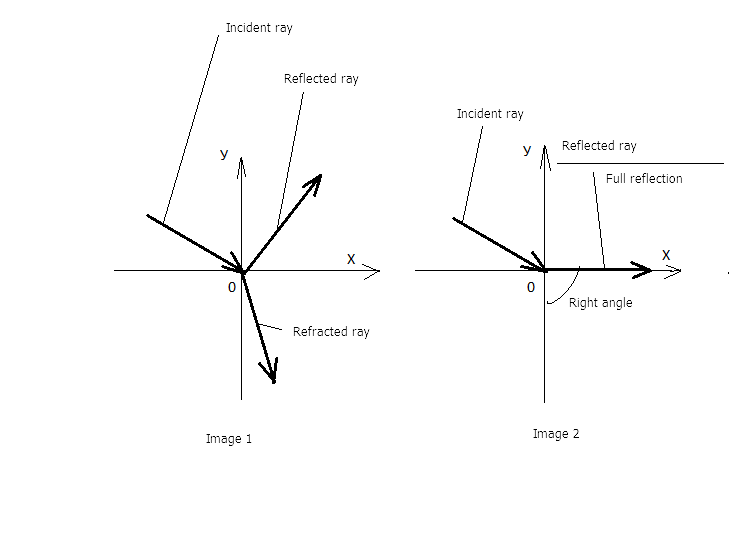
Let's try to interpret this figure from a book on optics in terms of trend classification. In figure 2 we see the full reflection angle, when the reflected ray is directed along the OX axis.
Conclusion: There are 4 trend types on any timeframe.
1. Uptrend
2. Downtrend
3. Upper flat trend (an uptrend has ended, but the trend has not reversed yet)
4. Lower flat trend (a downtrend has ended, but the trend has not reversed yet)
The concept of flat can be expanded if analyzed in terms of optics. In addition to the standard trading definition of flat, we can add that it can occur in the upper part of an uptrend (upper flat) or in the lower part of a downtrend (lower flat). When analyzing flat, it is necessary to check the timeframe it occurred on.
Example of flat on D1

Here the flat on D1 is limited by a channel of 1374 points (for 4-digit quotes). One cannot expect a stable trend on this timeframe until the price exits this channel.
From the point of view of the angular analysis, it seems that the trend moves horizontally while gaining and increasing its turning angle, and then trend reverses. But sometimes the trend is influenced by the trend of a higher timeframe. In this case, the reversal is canceled, and the trend continues into the "major" direction as per the general movement of the higher timeframe.
Based on the above idea, we can formulate the basic angular analysis problems. These are:
- Determining the most effective angles for analyzing the trend within one timeframe
- Identifying angle signals that can be useful for trading
- Determining trend reversal angles within one timeframe
What Angles Are More Effective for Technical Analysis?
As already described above, we can use the following types of angles for trend analysis:
- Horizontal (between the trend and the OX axis);
- Vertical (between the trend and the OY axis);
- Turning angles (between two different trend directions).
Let's consider the features of horizontal and vertical angles when used for different timeframes.
The below image shows how angles appear on М1:
The most effective angle for M1 is horizontal, while the rest angles are difficult to read or analyze.
Consider the M5 timeframe.
Consider the M5 timeframe.
М15.
Н1.

Н4.
D1.

Conclusions about the use of different angles for different timeframes:
- on lower timeframes (М1, М5), it is visually more convenient to use horizontal angles (which are clearly visible on the chart);
- on medium timeframes (М15, Н1, Н4), turning, horizontal and vertical angles look good;
- on higher timeframes (above H4), vertical angles and turning angles increase substantially, while horizontal angles are minimized and become difficult to read;
- the angle indicator is best suited for timeframes М1 to Н4; horizontal or vertical angles are more convenient on separate timeframes;
- turning angles are often increased before the new trend direction, but still they are more like angles anticipating trend continuation rather than reversal;
- real turning angles that would unambiguously mean upcoming trend reversal have not been found yet;
- also, a useful practical application of a combination of turning, horizontal and vertical angles on one timeframe and the explicit relationship between them have not been found yet;
- for an effective trend analysis, new angles types should be studied.
New Angles for Technical Analysis
Let us do the following, in order to quickly receive the final result and the required types of angles:
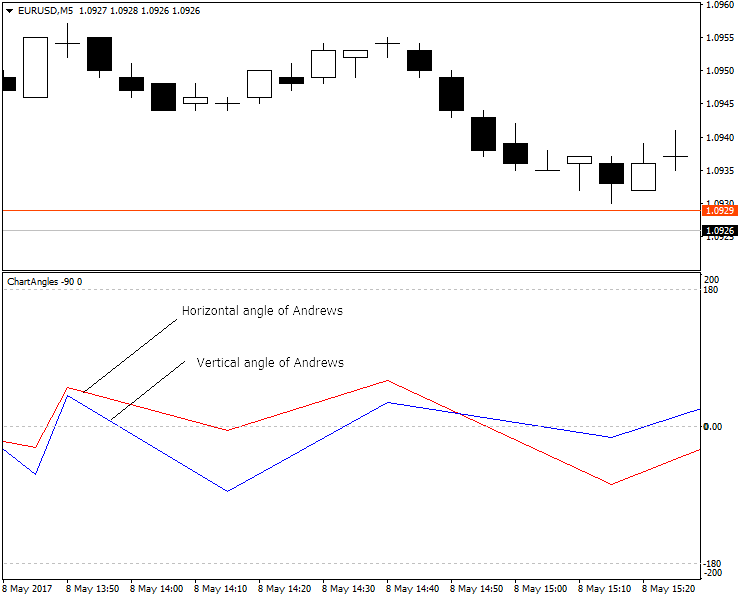
1) We take Andrew's median line, but it will be built based on a bisector of an angle instead of the median;
2) Now we draw a turning, horizontal and vertical angles for the Andrews' median line.
If the horizontal Andrews' angle (the red line color) is greater than the vertical Andrews' angle, it is a sign of a falling trend.
If the vertical Andrews' angle (the blue line color) is greater than the horizontal Andrews' angle, it is a sign of a rising trend.
If the horizontal Andrews' angle (the red line color) is greater than the vertical Andrews' angle, it is a sign of a falling trend.
If the vertical Andrews' angle (the blue line color) is greater than the horizontal Andrews' angle, it is a sign of a rising trend.
They look pretty clear. Let's try to find effective signals for determining the trend in these angles.
The result of detecting signals using new Andrews' angles is as follows:
Sell (sell close) signals.

Buy (buy close) signals.

An example for М1 (5 decimal places).

Sell signals: the upper red peak after an upper read trough.
Sell close (Buy) signals: the upper blue trough after an upper peak.
Sell close (Buy) signals: the upper blue trough after an upper peak.
М5.

М15.

The angle indicator performs well on historic data, while current values are redrawn.
To smooth the redraw effect, Elder method can be used, during which we simultaneously analyze several different timeframes of the same currency pair (three Elder screens).
For our example, we will use two timeframes instead of three (i.e. two angle indicators with a proportional number of bars) and obtain the following results. You can see in the above figure that indicator values on a lower timeframe (thin lines) can be corrected based on the values of a higher timeframe.
Н1 with two indicators
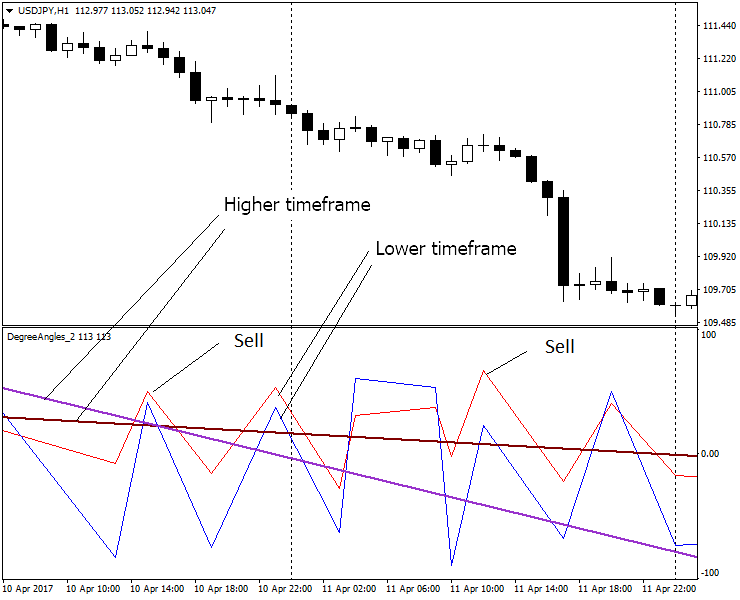
Let's consider, what angles allow receiving signals for different timeframes from М1 to Н1.
Description of trading signals:
Preliminary signals:
1. "Attention, get ready for buy open"P: the upper blue peak;
2. "Attention, get ready for sell open": the upper red trough;
3. "Attention, get ready for buy close": the upper red peak;
4. "Attention, get ready for sell close": the upper blue trough;
Executive signals:
1. "Buy open": the upper blue trough;
2. "Sell open": the upper red peak;
3. "Buy close": the upper red peak;
4. "Sell close": the upper blue trough;
5. "Add buy": the second consecutive upper blue trough;
6. "Add sell": the second consecutive upper red peak.
If we continue to use the indicator on higher timeframes, e.g. H4, we obtain the following results:

As you can see, the accuracy of the angle indicator is lost on H4. The use of angle indicators does not provide a serious practical advantage on H4. Other analysis tools and approaches should be used here.
Conclusions
We have conducted a small study on the use of angles for technical analysis. We have shown variants of use of various angles.
We still need to study the features of summation of angles of different timeframes. Good results were achieved by A. Prasov. He provides an advanced useful strategy of how to use angles in trading.
The study of new angles continues, and there are more unexplored and unknown points than already known. These indicators are obtained as a result of multiple attempts to find an approach to the measurement of angles.
In the article, I used angle indicators developed to order (I do not program myself, alas):
The Angles_3_points indicator is designed for manual setting of three points for measuring angles on history (set three points by clicking on the "Points" menu) or the current angle (two points are set from "Points", and the third one is set by clicking "Bid"). A point is set at the required location by a double click, similar to the way it is done in the terminal. Once the point location is fixed, the next one can be set. Points on the chart can be moved. To do this, double-click on the desired point and drag it to a new location, then double-click on it again. The result of measuring the angles is shown in the price chart.
We tried to eliminate the deformation connected with timeframe switching (that is why the values of indicators are more reliable than the standard MT tool "Trendline by angle").
The ChartAngles indicator automatically measures angles and displays them in the additional window below the chart. The indicator draws two types of angles: usual (horizontal, vertical, turning) and Andrews' angles (horizontal, vertical and turning). Required levels should be enabled in the settings, while the rest should be disabled. The color of various angle lines can be configured in the indicator settings. The indicator uses the ZigZag indicator. The indicator uses the principle of screen deformation elimination described in Angles_3_points. The number of bars is sent in parameters, based on which the indicator plots angles.
The DegreeAngles_Zero indicator automatically measures angles and draws them in the additional window below the chart for two different angles using the different number of bars. Its distinctive feature is that instead of using the Zigzag indicator, it uses the regression line. This makes the indicator values more accurate. Set the number of bars for the two indicators, the color and width of the lines, and also the type of angles. Then the indicator will draw the angles.
I repeat that practically useful signals of these indicators were obtained for Andrews' lines using a bisector. Vertical and horizontal angles based on the bisector, as well as their intersection, help to determine the trend. The turning Andrews' angle using the bisector also seems to be potentially useful for the practical trading.
An Expert Adviser using these indicators is currently being developed.
For a proper operation of the Angles_3_points indicator, it is necessary to install the attached font.
Attached files |
ChartAngles_v3.ex4 (58.18 KB)
6ijt0_GILSANUB.zip (46.57 KB)
Angles_3_points.mq4 (100.23 KB)
DegreeAnglesZero.mq4 (47.65 KB)


ความคิดเห็น
แสดงความคิดเห็น