Nial Fuller คือเทรดเดอร์อิสระที่เป็นที่รู้จักกันดีในฐานะเทรดเดอร์ค่าเงินสไตล์ price action ที่พยายามเผยแพร่แนวคิดและวิธีการในการทำกำไรของเขาผ่านเว็บไซต์ส่วนตัว ด้วยแนวคิดที่เข้าใจง่ายไม่ซับซ้อน บวกกับความสามารถในการถ่ายทอดที่ทำให้มือใหม่ทั้งหลายสามารถเรียนรู้ได้ ทำให้เขาเป็นอาจารย์สอนเทรดค่าเงินที่มีผู้ติดตามมากที่สุดคนนึง ในแต่ละปีจะมีผู้ติดตามอ่าน website ของเขามากกว่า 500,000 คน เทคนิคการเทรดค่าเงินของ Nial นั้นจะใช้สไตล์ price action เท่านั้น เขาจะไม่สนใจอินดิเคเตอร์ โดยหลักการของเขาคือเขาจะพิจารณาว่าราคาได้ “กระทำต่อ” แนวรับแนวต้านอย่างไร รวมถึงการดูรูปแบบการฟอร์มตัวของแท่งเทียน เพื่อหาจังหวะเข้า order เขาอธิบายว่า กราฟที่ดูสับสนวุ่นวายด้วย indy เต็มหน้าจอ นอกจากจะทำให้คุณเครียดเพราะเข้าใจมันยากแล้ว คุณยังต้องปวดหัวกับการตีความมันด้วย สุดท้ายคุณคงต้องสับสนในตัวเองแน่ๆ เขาบอกว่าทำไมคุณไม่ทำให้มันง่ายกว่านั้นล่ะ ในเมื่อกราฟเปล่าๆ ก็สามารถช่วยให้คุณหาแนวโน้มและทิศทาง รวมถึงหาจังหวะเข้าเทรดได้เหมือนกัน Messy Chart Clean Chart สำหรับวิธีการเทรดโดยใช้ price action นั้น ...


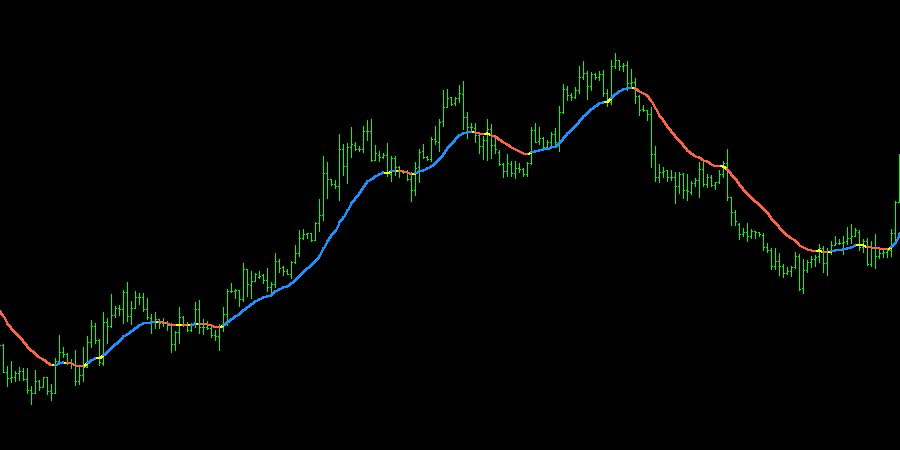 The Colored Moving Average indicator show colored whether the market is in an uptrend or downtrend.Input parameters [Download##download##]


ความคิดเห็น
แสดงความคิดเห็น