

- [vtab]
- Multi Pair RSi indicator
- About the Multi Pair RSI indicator
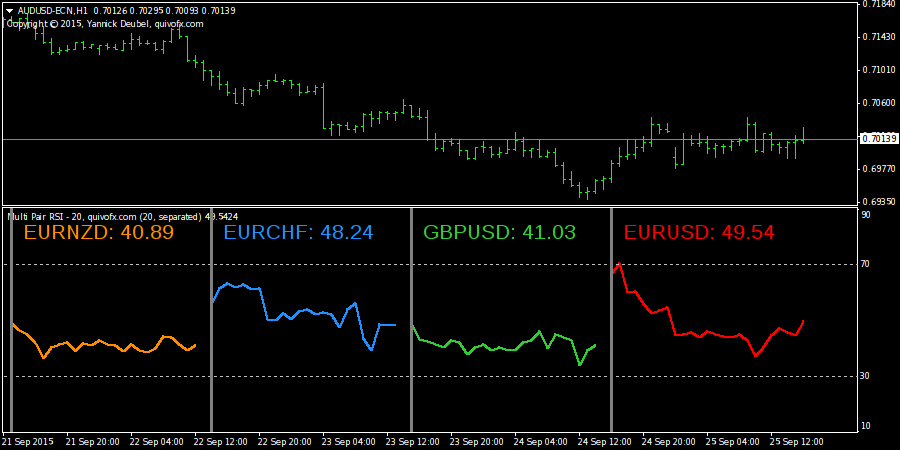
The Multi Pair RSi indicator shows you up to 8 different RSI from the pairs of your choise. You can choose whether you want to draw all RSI in one window or in different windows.
Input parameters
- RSI Period
- Symbol Prefix/Suffix
Insert your symbols prefix and suffix
- Display Mode
Show Text Right
Show Text Above
Show Separated Charts
Show Only Text
- Max Bars
You can leave this to 1000
-Indicator Label
You can leave this to “Show Symbols”
-Symbols
Enter up to 8 different Currency Pairs
-Indicator Style
Font Size
Line Width
Max Windows Shown in Separated Mode
Indicator minimum/maximum
Draw Horizontal Line?
Choose the colors for every pair [Download##download##] - High/Low Channel Indicator (Donchian Channel Indicator)
- About this indicator
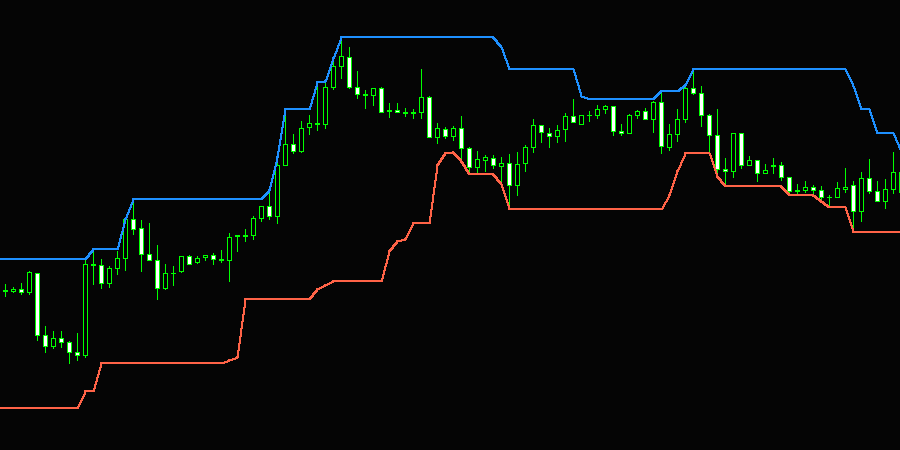
The High/Low Channel Indicator (also called Donchian Channel Indicator) draws the High and Low of the last X bars on your chart.
Parameters for the High/Low Channel indicator
Calculated Bars: Averaging period for calculation
Deviations in Pips: Number of standard deviations from the main line.[Download##download##] - Colored Stochastic Oscillator Indicator
- About the Colored Stochastic Oscillator indicator
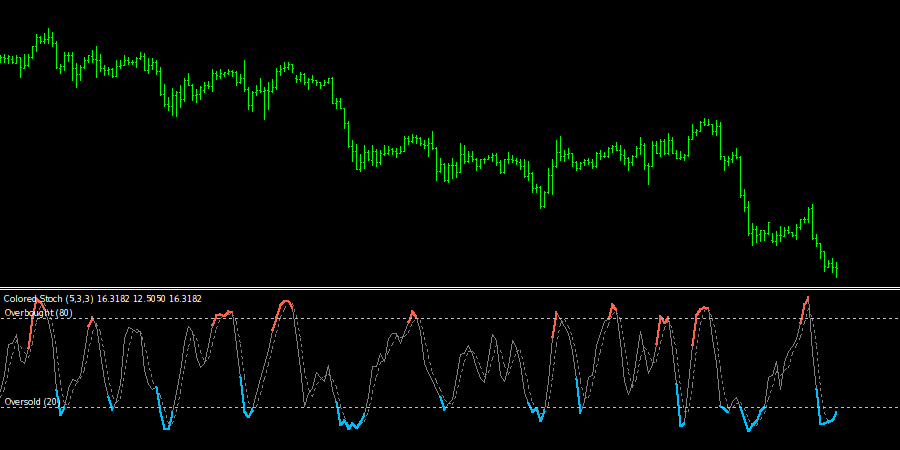
The Colored Stochastic Oscillator shows exactly the same lines as the default Stochastic Oscillator does, but he shows the OverSold and the OverBought levels in color.
Strategy
Sell if the Stochastic line is red.
Buy if the Stochastic line is blue.
Input parameters
- Period of the %K line
- Period of the %D line
- Slowing value
- Moving Average method
- Price field
- Timeframe
- Overbought Level
- Oversold Level
- Max Bars [Download##download##] - Colored Moving Average Indicator
- About the Colored Moving Average indicator
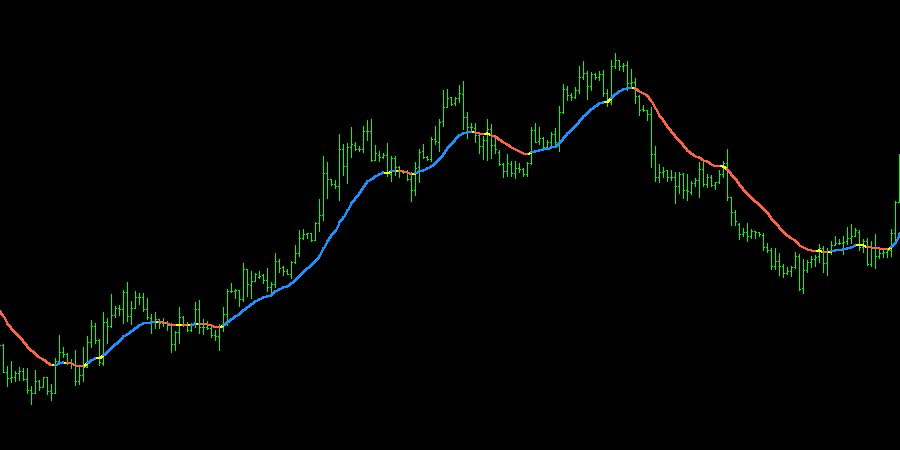 The Colored Moving Average indicator show colored whether the market is in an uptrend or downtrend.Input parameters [Download##download##]


ความคิดเห็น
แสดงความคิดเห็น